net zero year

Net Zero Year - Results

We tested our Net Zero home from October 18, 2010 to October 18, 2011. The initial post is here, and these are the questions that we wanted to answer.

The bottom line is that our house did not produce as much energy as it used throughout the course of the year. It was not a net zero energy house during the period indicated. Here are the numbers:

Net energy use: 2518 kWh

We used 2518 kWh more than we produced over the year for all of our energy needs (that's all electricity, as we are not connected to natural gas and we didn't use our wood stove at all). 

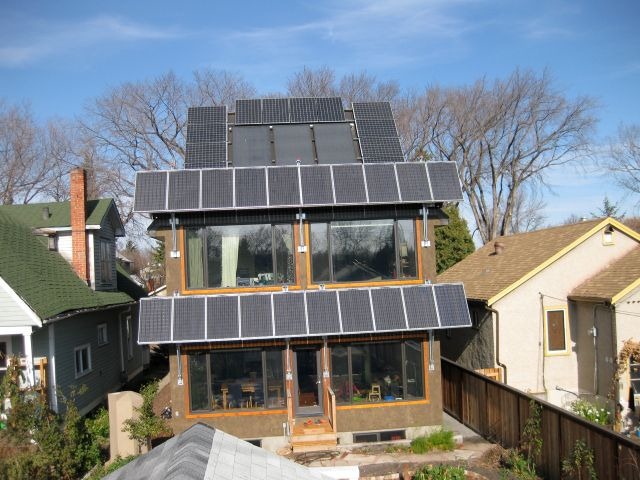
Total solar production: 7212 kWh

Our solar modules produced at a decent clip, although at slightly lower-than-average levels for Edmonton.

Total energy consumption:  9730 kWh

So what happened? Well, as I said at the outset, we didn't define Net Zero before we started out. Net Zero every year? On a ten year average? What we do know is that this  year, we didn't hit our goal.

Here's a bit of post mortem analysis.

  • This house is clearly not going to be net zero every year. We missed by a relative long shot. Why?
    • It was almost 14% colder than average in the fourth quarter of 2010 (source).
    • It was overcast for virtually the entire month of March (as evidenced by my whining in this post). In March of 2010, we didn't heat at all, whereas in March 2011 we heated the house every day.
    • Given the year that we had, the HOT 2000 simulation only predicted about half of our heating energy use.
  • Given the two points above, I'm confident that our house will be net zero some years. Whether that's 20% of the time or 50%, it's impossible to say right now.
  • The average house (built between 1990 - 2003) in Edmonton uses 41,665 kWh for space heating and hot water (or 150 GJ -  pdf source) , and another 7800 kWh in general electricity use (pdf source). That's 49,465 kWh in total.
  • So, our house used 19.8% of the energy that a newer Edmonton home uses, and it then turned around and produced 75% of that energy as solar electricity.

It was interesting to watch how the house performed this past year. We're still sworn off of the wood stove, so I'll check in again on December 14  and we'll see how close we'll have got to net zero when measuring Dec 14, 2010 - Dec 14, 2011 (after all, if you're not happy with the data, just change the parameters!).


Edit: below are the heating degree numbers for the last 12 months. As you can see, there was a lot more heating required in Edmonton during the last 12 months than during the period of Nov 2009 - Nov 2010. Especially in March!

 read more... »

A Net Zero Energy Year : Summer

Times were good this summer, as our 6 Kilowatt PV system churned out the juice like crazy.

During the months of May, June, July and August we only imported power, on a net basis, on eight different days. Not bad, not bad at all.

Here is what the data looked like:

may

May 2011: 600 kWh exported.

jun

June 2011: 500 kWh exported.  read more... »

A Net Zero Energy Year : April 2011

image

Energy use, MCNZH, April 2011. Negative numbers represent export of electricity.

Our Net Zero Energy Year finally turned around in April. We stopped heating the house pretty much as of March 31, and it’s been generally sunny ever since.

Here are the numbers for Oct 18, 2010 – April 30, 2011 (all units in kWh of electricity):

Consumption: 7643

Production: 2785

Net Consumption: –4858

We’re in the hole overall, but April was a net positive month. We exported 550 kWh to the grid!

A Net Zero Energy Year : February and March 2011


MillCreekNetZero

The above picture would actually be one of grey skies and snow if it represented March and February of 2011, but I’m not one to dwell on bad weather.

Barring a solar miracle, the Mill Creek Net Zero Home (MCNZH) will not be net zero in its energy consumption for the period of Oct 18, 2010 – Oct 17, 2011. The fact is, it was a tough winter for a passive solar house, with cold temperatures in February, and a very overcast March.  In 2010, for example, we virtually stopped heating the house by the second week of February. This year, it was April before the heaters stopped kicking in.

The results so far bring us back to some of the questions I asked when we started this little experiment. Although I have no sunshine data for this year, I’m sure that it was below average for insolation (how sunny it was). Here are some numbers on how sunny Edmonton has historically been:

 edmonton_sunshine_hours
(source)

The three-week period in March 2011 without a ray of sun makes me sure that we came well under these numbers this winter.

Here are the numbers for Oct 18, 2010 – March 31, 2011 (all units in kWh of electricity):

Consumption: 7333
Production: 1925

So we’re –5408 on a net basis for the year. Even though we’re just entering our prime solar production months, I don’t think we’ll cover the bet.

Here is a snapshot of the net power consumption for the months of February and March, 2011. Negative numbers represent exporting of power to the grid:

image

image

Our net energy use was higher in March than in February due to the aforementioned overcast weather.

A couple of daily snapshots:

image

March 28, 2011 was a terrible day for solar houses in Edmonton. The sun hadn’t shone for days, so the thermal mass in the house had lost its solar charge. The weather wasn’t that cold (low of –5, high of 0), but the heaters ran all day to keep the house heated.

image

On the other hand, February 25, 2011 was the kind of day that our house was built for: brutally cold (a low of –26, high of –9) but sunny. Notice how the energy use is much lower after 6pm than it was in the middle of the night. That is the residual effect of the day’s sun keeping the heating load down.

These days our PV arrays are really cranking out the juice. It will be interesting to see how close we can come to overcoming our deficit.